
How Aircraft Maintenance Engineers use the Gantt Chart for tasks
The Gantt Chart – named after its creator Henry Gantt – is a type of bar chart that tracks task durations.
These timelines let you see how long a project will take, and identify tasks that are hurting your project schedule the most.
Oh, and don’t spend hundreds (or even thousands) of dollars on Gantt chart software. You don’t need it. Adding complexity to a Gantt is to take away from its singular focus…
What is Task Time?
Time in the form of hours, days, weeks, and months. Yes, we have a free template – one used by one of the biggest Aviation MROs in the world, so stop surfing and pay attention.
But first, you need to know a few things before you download it and start planning.
Gantt charts are superb tools. So good that they should have been taught to us since our school days. Why?
Because it gives you the gift of Free Time and allows you to use planning strategy as a way to make time work for you and not against you.
What is a GANTT Chart?
A Gantt is a project management tool (excel spreadsheet is perfect) that lists tasks in a column on the left (Y-axis) and the project timeline in hours, days, or months across the top horizontal bar chart (x-axis).
These tasks can be macro or micro and as detailed as you want but should describe the Endpoint desired. Or what we can “End Status”.
If you know where you are trying to get to – you can use a chart template to predict how long complex projects will take, what the milestones are, and most importantly how you can manage project tasks across time when you need them the most.
Here is a snapshot of the Gantt download.
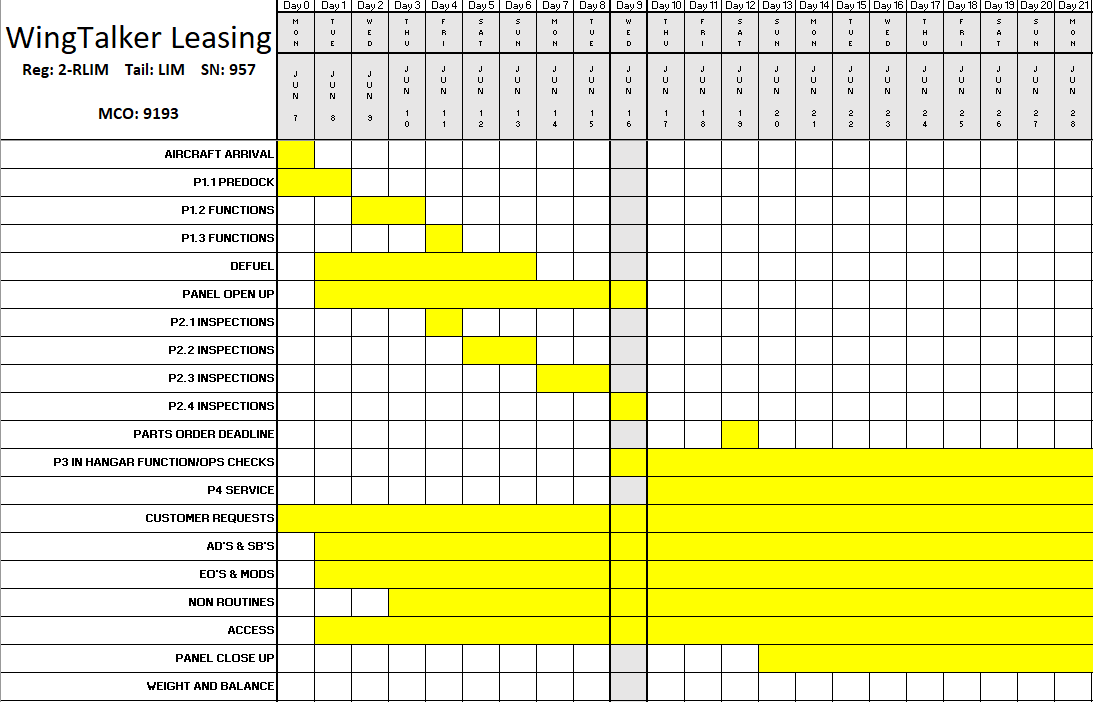
See how simple it is?
Now imagine showing this to any department head or CEO and getting their feedback, sign-off, or funding for more resources to speed up critical or expensive tasks?. It also holds people to account as their project progress will be writ large in Courier 10pt. We could give you the actual Gannt definition, but instead, we want to give you its most important ingredient…
Gantt Task Dependency Relationships
Unless you’re a company like META or TESLA, you probably have a limited group of people with limited time. So what you need to be concerned with is the use of their limited time.
In a way that ensures the project phase is completed as quickly as possible (or car designed, eVTOL tested, or proposal delivered). Gannt Chart Tools allow you to do this as cost-effectively as possible.
GANTT Elements
Here is what the Gantt will tell you at a glance;
Project Tasks
Tasks to be done (task progress and end status to be reached)
Project Timeline
The Start and End dates of each task
Task List
The List of Tasks, time estimates, and project real-time
Dependencies between tasks
Dependent tasks – (which tasks must be done for another task to begin) – How they group together, overlap or link with each other
Major Milestones
For financial/budgetary reasons
The Project “Critical Path method”
The time loss-leader tasks that could cost you

How to create a Gantt Chart
Here is how we created our chart type. Tasks to be done are listed on the vertical axis. On the horizontal axis, you show a timeline suited to your project displayed as a task bar.
As you populate the tasks, the time you input will create a bar in the timeline. Sure, some chart software will do this automatically but when it comes to project management we really suggest you do this manually. You want the times and tasks to be burned into your brain.
But if you prefer shiny buttons and colors then go ahead and buy a software tool. Certainly, if your entire professional life is Gantt charts then maybe you can use those added chart software resources, but take it from us. Start with a hands-on approach. One wrong entry in a way-to-complicated program could be missed. And your entire project could be out by a factor of 10.
Gantt Chart Objectives
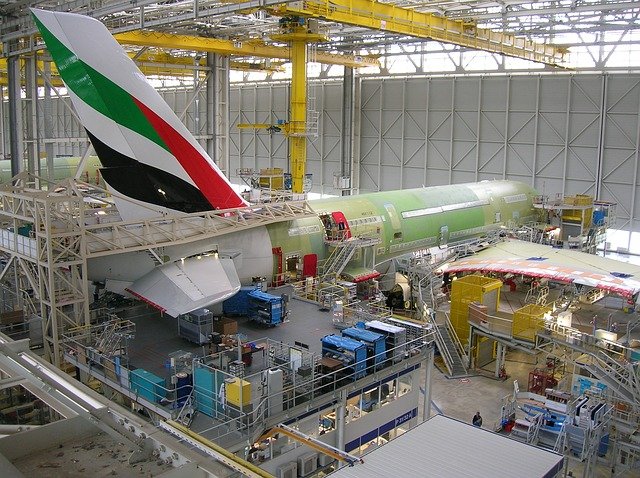
Aircraft maintenance organizations use Gannt charts to keep projects on track. As you will see in the example provided. A number of project objectives are scheduled when an aircraft is inducted into a maintenance facility for a scheduled “check”. In the Work scope document by a mechanical engineer.
Briefly (and very non-comprehensively) this will include
- Airframe Checks
- Fuel Tank Maintenance
- Component inspections
- Landing Gear Overhaul
- Corrosion inspections
And a thousand other systems or structure or instrument checks for project teams. The breakdown structure is where the Gantt chart comes into its own. Especially on tasks that rely on third parties. Or to track specialist shops where parts need to be bench tested.
Or other parts (and consumables) being ordered on a just-in-time basis by the materials department.
Real World Gantt Example
Here’s a real example of a real time problem we had recently. On an aircraft redelivery check, we forgot to order replacement fuel nozzles for a Pratt & Whitney propeller engine.
The task was missed.
Let’s leave it at that. Once we found the replacement nozzles and found out how long it was going to take to order, deliver, fit the nozzles, run engine tests and certify the engines our Gantt chart showed us that our redelivery schedule was going to miss by two weeks.

But when we got the team involved and studied the Gantt chart over a cozy hanger fire and some smores – we figured out how to move nozzles around from other aircraft also due in for maintenance.
We swopped these key components and a few days here and there and voila, we pretty much got outta dodge. Without the Gantt chart critical path analysis (to look at the resources and who was doing what and when) we would have been snookered.
Our Tips for GANTT
So whether you are fixing a B777, building a bridge, or getting a proposal together for a government project due in June, you should be getting a Gantt chart ready. Here are a few pro tips that might ensure its success.
- Get your project heads (or team) in for a meeting and Stick that Gantt up on the overhead.
- Try to break the project into its biggest components first – dates of tasks – ideally per department that will take ownership. Start with critical tasks.
- Get a project manager if you are not the one overseeing the project. We send an engineer on all shop visits. All he does is sit in the meetings where the Gantt is being discussed. And he never misses a beat.
- Try to get each major task its own Gantt chart for further analysis and visualization.
- Ask the project manager to look closely at the TASK DEPENDENCIES and SCHEDULING OF PROJECTS. Which can be done in parallel? What can be done by the same teams? Where are my critical paths and how can I protect these? What are my critical expenditures?.
- Look at the top 10 biggest cost elements of the project and try to look at their task dependencies. What you want to avoid is these tasks getting out of control or worse still being ready to go but cannot due to failures elsewhere. You do not want to be paying for people to stand around or paying twice for solutions that turned up once and couldn’t start because other things were not completed on time.
Or if you wish go to a chart software provider of this very solution, this is a good one.